 |
| F-35A USAF Photo |
There’s evidence the report is either a blatant political hack job or there are absolutely NO experts on Reliability at the GAO. Take your pick – either reason is equally damning.
Has anyone else noticed the comparative ‘silence’ over the last F-35 GAO report compared to the previous releases? Other than the rather strange and rambling “F-35 by the Numbers” at DoD Buzz and the usual unattributed fear-mongering about “Costs!” at AOLPOGO Defense , this time around there hasn’t been much caterwauling coming out from under the usual rocks. My first thought was perhaps the POGO et al crowd was winding up to deliver another integrated PR attack against the program across a broad far-left front.
I decided to take the time to actually read the report itself in hopes of perhaps getting a preview of the latest Doomsayer topic du jour. Imagine my surprise when I found……not much: no blockbuster surprises, and surprisingly little hard information. There’s no ‘there’ there. It is “Same Sh*t. Different Day” in GAO-land.
There is a lot of unmitigated puffery and bull-hooey in this latest edition from the GAO. A good portion of it hinges on understanding the little ‘something’ within (as well as the missing associated bits) the report that strikes this experienced eye as more than a trifle ‘odd’. It is bizarre to the point it raises my suspicions that the F-35 program may either progressing better than ‘some’ would have us believe, or at least NOT doing as poorly as those same ‘some’ WISH we would believe.
If the GAO’s failings in this report are due to incompetence and inexperience, as is always my first instinct, I think that speaks of an even more unfortunate situation. We can overcome intrigue with the light from facts, figures and reason. But institutionalized incompetence? That can be a much tougher nut to crack. It was the part of the report that I found dubious. Quite frankly, it makes me wonder what it is doing in this report at all, unless its entire purpose is to prop up the rest of the report:
According to program office data,
the CTOL and STOVL variants are behind expected reliability growth plans at
this point in the program. Figure 9 depicts progress of each variant in
demonstrating mean flying hours between failures as reported by the program
office in October 2011 and compares them to 2010 rates, the expectation at this
point in time, and the ultimate goal at maturity.
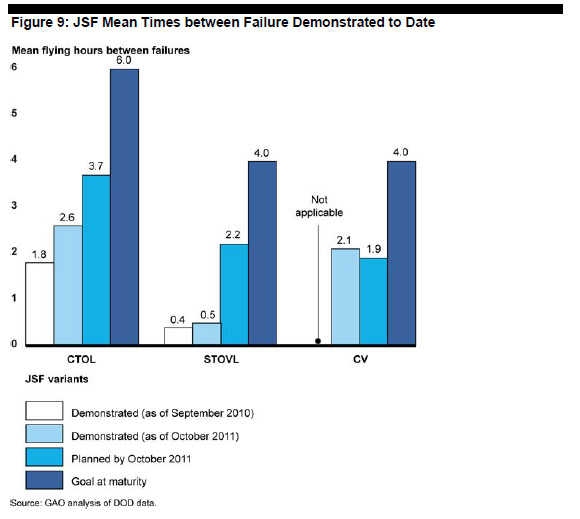
As of October 2011, reliability growth plans called for the STOVL to have achieved at least 2.2 flying hours between failures and the CTOL at least 3.7 hours by this point in the program. The STOVL is significantly behind plans, achieving about 0.5 hours between failures, or less than 25 percent of the plan. CTOL variant has demonstrated 2.6 hours between failures, about 70 percent of the rate expected at this point in time. The carrier variant is slightly ahead of its plan; however, it has flown many fewer flights and hours than the other variants.
JSF officials said that reliability rates are tracking below expectations primarily because identified fixes to correct deficiencies are not being implemented and tested in a timely manner. Officials also said the growth rate is difficult to track and to confidently project expected performance at maturity because of insufficient data from the relatively small number of flight hours flown. Based on the initial low reliability demonstrated thus far, the Director of Operational Test and Evaluation reported that the JSF has a significant challenge ahead to provide sufficient reliability growth to meet the operational requirement.
For future reference then, I offer an introductory tutorial on how aircraft 'reliability' programs work, I’ll focus mostly on the F-35A numbers, but what is true for the F-35A is even truer for the F-35B and C as they have even fewer flight hours.
Aircraft Reliability Isn’t Graded in the Cradle
Let’s begin by noting that by the end of October 2011, the timeframe given above, only approximately 2000 total flight hours had beenflown by all three F-35 variants. Given the F-35A had been flying more and in larger numbers than the other variants through to that timeframe, we can safely assume the F-35A flight hours make up at least half of the 2000 hour total (~1000-1200 hours?). The failure rates shown for the CTOL version include those flown by AA-1, the de facto F-35 prototype which was markedly different from later aircraft (and is now retired from flight and undergoing live fire testing). Given that the typical operating hours accumulated before aircraft type designs are considered ‘mature’ enough to evaluate and grade system reliability is 100,000 fleet flight hours (RAND TR-763Summary, Pg xiii), just mentioning an F-35A reliability metric at the ~1% mark is pointless. Assigning any meaning to the same value and framing a narrative around it demonstrates profound stupidity and/or a hostile agenda.As there are three major variants of the F-35, and the chart above shows values for all three variants, I would assume there was cause for the program to take some composite approach to benchmarking the F-35, whereby a value lower than 100,000 hours for each variant may have been selected due to commonality and overlap between systems (100000 hours for each variant, while more statistically pure for benchmarking performance would have probably seemed as overgenerous and overkill to non-R&Mers… especially ‘bean counters’). Unless the program is supremely confident in the parts of the F-35 that are unique to each variant, they should keep the 100,000 hour benchmark at least for those unique variant aspects, but given the complexity of tracking partial and full system reliability, I doubt any program would view such an approach to reliability as workable. This means that when they get to a point late in the maturation process, that if the unique systems and features of the variants aren’t measured against a 100,000 hours benchmark, they had better be ‘ahead of the curve’ for what normally would be expected in their reliability performance.
How Programs Track Reliability Growth
One may ask: How programs achieve target reliability benchmarks in their maturity if they aren’t being ‘graded’ on their progress as they go forward? The answer is they ARE evaluated; it is just that they are evaluated in terms of trends for discovering and eliminating root causes, as well as in relation to other metrics to arrive at what the performance ‘means’ as part of the process of achieving required system reliability . Depending upon how far along the program is in maturing the system; the reliability performance at the time will mean different things and require different corrective or reinforcing actions. To illustrate what is evaluated, how a system is ‘matured’, and why it is impossible for a system to be ‘mature’ when it is first fielded, it is helpful to employ a typical reliability chart format with notional data for further reference and discussion. The following chart plots out a hypothetical weapon system’s Mean Time Between Critical Failure (MTBCF) performance, as I suspect the GAO report incorrectly refers to as ‘Mean Time Between Failure’, though all the observations we are about to make concerning same are true in either case. ‘Conveniently’ for our purposes, the hypothetical weapon system in this chart has the identical 2.60 hours MTBCF at 2000 hours, with the ultimate goal of 6 Hours MTBCF at 100000 flight hours, the same as noted in the GAO report for the F-35A. |
| Notional MTBCF Plot: Copyright 2012 Elements of Power |
The reader should immediately note that the chart above is plotted in a ‘Log-Log’ format: both chart axes are plotted using a logarithmic scale. This has the effect of allowing the clear display of early values, where wider variations in data are to be expected and of showing trends (and deviations from same) more accurately. As more statistically relevant data is accumulated, on through to where the system maturity point is selected for determination as to whether or not the system meets the reliability requirement, the deviation from the mean value should lessen (more about that later). The reader should also observe that there are three values logged after the notional 2.60 ‘measurement’.
These values illustrate that the ‘current’ value evaluated at any point in time is usually a few measurements behind the latest measurements because the latest values will have to be “adjudicated” to ensure they are error free. Adjudication can be a daunting, time-consuming process (voice of experience) that often requires iterative communications between the Reliability and Maintainability group and units in the field before the data is purged of errors.
Some actual examples come to mind that illustrate how errors are introduced. On one of my past programs, there was an episode where there appeared to be a sudden increase in failures and subsequent removal and replacement of a cockpit component. It was only through careful review and correlation of several months’ worth of event data that impossible crew sizes (you can’t get 20+ people in a cockpit at one time) were revealed, which led to R&M eventually finding out that the maintainer organizations were running a series of training events and incorrectly logging them against the aircraft.
The adjudication process itself may also contribute to the eventual improvement of the weapon system’s reliability score. One category of maintenance logged against an aircraft is ‘For Other Maintenance’ (FOM). “Once upon a time” a certain weapon system was showing excessive low observable “Red X” events which flagged a certain area of the plane as experiencing frequent Low Observable outer-mold line (surface) failures (this also generated an inordinate amount of aircraft ‘downtime’ affecting another metric). Through inaccurate logging of the ‘How Malfunctioned’ (How Mal) code, the data masked the fact that the LO maintenance was driven by the need to restore the surface treatments to complete the removal and replacement (R&R) of a component located behind the surface that required restoration. This incorrect data not only pointed the program R&M efforts in a wrong direction, it helped mask the impact, and delayed the ‘fixing’, of what was considered prior to this discovery to be a low priority “nuisance” software glitch. Priority was then given to fixing the ‘glitch’ and along with a change to tech data, a maintenance and reliability ‘high-driver’ was completely eliminated.
The values shown at individual points on the chart above are not the cumulative value from current and all previous data points. They represent a value arrived at from a regression analysis of the last 3-6 data points (usually taken monthly) and the latest snapshot trends are used for further evaluation in conjunction with other performance data to determine true progress and problem trends. I’ve placed markers at various flight hour totals to illustrate points where the possible half-way and full reliability flight hour measurement periods might be for our hypothetical program to illustrate just how far away 1000-1200 flight hours are from any likely MTBCF ‘grading’ point.
Dominant Factors When Experience is Low
‘Failures’ logged and tracked fall into three broad categories: Inherent or Design-Driven, Induced, or No Fault Found/Cannot Duplicate (NFF/CND) aka ‘false alarm’. When the flight hours of a new weapon system are few, the data tends to be more representative of operator and program learning curves than actual aircraft reliability, to the point that ‘No Fault Found’ and ‘Induced’ often represent one half to two-thirds of the total ‘failures’ so it is entirely within the realm of the possible that this is true at this time for the F-35. If the F-35 failure rate was driven by design problems we would expect to also see the GAO warning of undesirable ‘mission readiness rates’, ‘maintenance man-hours per flying hours’ or other negative performance measures. Without these kinds of details, any standalone MTBCF number is meaningless. Given there is no mention in the (GAO) report what we would expect to see if the F-35’s ‘failures’ to-date were dominated by design problems, I suspect the design reliability might be seen as ‘pretty good’ at this point in time by the R&Mers (Program Managers will always want ‘more’-and ‘sooner’-- so one will ever claim ‘good enough’ until all the reliability measurement hours are adjudicated).
 |
| US Navy Photo |
STOVL Sidebar
The GAO report notes the STOVL ‘reliability’ figure as being even farther below the ‘expected’ value. As the first production F-35Bs were delivered in January of 2012 after the period ‘graded’, and the total hours flown must be far less than even the ‘A’ model’s paltry ~1000-1200 flight hours, the GAO even showing the numbers, much asserting that the “STOVL is significantly behind plans” is pitiable ignorant, but still useful for two reasons I’m certain the GAO didn’t intend.
First, the GAO’s statements clearly tie the numbers presented to a ‘plan’, Whether this ‘plan’ they refer to is the calendar schedule (which I suspect is true) or they are referring to planned flight hours through October 2011, both are inappropriate to use for MTB(C)F. The ACTUAL hours are what are relevant to the metric, and we’ve already covered how limited experience means less meaningful data.
Second, the STOVL observations help highlight something I’ve dealt with previously in managing small fleet performance improvements: something I call “The Tyranny of Small Numbers”. The very limited number of aircraft evaluated means that even a single ‘early’ failure event for one aircraft carries larger penalties than for a larger fleet. May we expect many more years of ‘behind plan’ reports from the GAO as a result of the ‘concurrency’ bogeyman used as an excuse to stretch the program?
At the end of the period covered in the GAO report was when the B models were getting some pretty important part number rollovers implemented. Besides also highlighting the fact GAO is always way behind in reporting compared to the current status and thus always out of date, perhaps this was the source of the “because identified fixes to correct deficiencies are not being implemented and tested in a timely manner” cheap shot in the GAO report? (More about that below.)
How Programs Manage Reliability Growth to Maturity
In viewing the chart above, the reader will see three dashed lines. The ‘red line’ is established at a level where the program sets a value where the program has decided any time the metric moves below the red line will trigger extra attention as to determining root causes, evaluating corrective actions in work and/or possibly decide additional actions are warranted. The ‘blue line’ represents the level of desired or expected reliability performance at every point along the timeline. As the program proceeds the values recorded should cluster progressively tighter at or above the blue line. Both the red and the blue line may be straight lines as shown, or curved. They may also incorporate ‘steps’ to reflect intermediate thresholds that the program office is expecting to meet. If the system performance moves much above the ‘green line’ representing the weapon system’s specified reliability requirement, believe it or not the program may review the weapon system to eliminate the ‘extra’ reliability if the extra reliability is achieved by incurring associated higher costs.
Value and Tradeoffs
It must be remembered that every performance specification requirement is arrived at during the requirements process by making tradeoffs between performance values and the costs to achieve those values to meet mission requirements. If any single performance metric, such as MTBCF fails to achieve the specified levels, the real impact of same is not understood by just looking at the metric as a standalone. MTBCF is one of the more interesting metrics in that once the MTBCF rises above the expected (and designed) sortie length, the relevance of the metric begins shifting more towards its implications for and impacts to other metrics. By way of example, if our hypothetical program achieves 5.9 hours MTBCF, the probability of successfully completing the mission is reduced by an insignificant amount compared to the specified 6.0 hours. If the Mean Time to Repair (MTTR) is but a fraction of the allowable time and/or the Maintenance Man-Hours Per Flying Hour (MMH/FH) is lower than the maximum allowable, the program office would have to determine the value (cost vs. benefit) of pursuing that last 6 minutes between failures before deciding to ‘go after it’. By ‘value’ I mean if such metrics as the MTTR and MMH/FH are better than the predicted and required levels, the program will have to examine the impact of the increased material costs (if any) from that 6 minute 'shortfall' over the life of the program in balance against all the other factors.
Since the GAO report fails to highlight the existence of poor MMH/FH and MTTR numbers, AND we know from the program announcements that flight test operations are ahead of current schedule for flights and test points, we can be almost certain that the internals of the performance data shine a better light on the program performance than the GAO is attempting to cast.
Of course even if all the data were known, this doesn’t mean a hypothetical POGO-like organization or sympathetic ‘news’ outlet wouldn’t, in their manifest ignorance and/or pursuit of a non-defense agenda, still bleat false claims of ‘cheating’ on the requirements. (Remember what I said earlier about institutionalized ignorance?).
Early in any program, there may be at any one time, one particular subsystem or component, or even false or induced failures that are standout ‘problems’ (Note: these days it is usually because systems do so well overall. Want to talk REAL maintenance burden? Pick something fielded before the 80s). In such instances the program may maintain and report two or more reliability number sets and plots showing trends for the overall system and the impacts of the offending parts or induced failure events on the overall performance as part of developing a corrective action. These contingencies very often need no more attention other than monitoring and are eventually cleared up through carrying out previously planned part number ‘rollovers’, completing the training of personnel, or updating technical data. The point again, is: mere snapshots of reliability performance without knowing trends and the ‘internals’ of the data are useless.
The GAO comment above stating “JSF officials said that reliability rates are tracking below expectations primarily because identified fixes to correct deficiencies are not being implemented and tested in a timely manner” is “priceless”--for two reasons. First, given that early MTBCF data is tenuous at best, this may again highlight GAO (and possibly F-35 Program) naiveté on the subject. Reacting prematurely with very little data to implement fixes to things that may not be a problem is a recipe for wasting money. Second, if the ‘fixes’ haven’t been implemented ‘yet’ it is probably due to the F-35 Program Office priorities in having them implemented: planes fielded to-date are needed for other program requirements and this would prevent ‘instant’ fixes.
The GAO comment above stating “JSF officials said that reliability rates are tracking below expectations primarily because identified fixes to correct deficiencies are not being implemented and tested in a timely manner” is “priceless”--for two reasons. First, given that early MTBCF data is tenuous at best, this may again highlight GAO (and possibly F-35 Program) naiveté on the subject. Reacting prematurely with very little data to implement fixes to things that may not be a problem is a recipe for wasting money. Second, if the ‘fixes’ haven’t been implemented ‘yet’ it is probably due to the F-35 Program Office priorities in having them implemented: planes fielded to-date are needed for other program requirements and this would prevent ‘instant’ fixes.
I seriously doubt the Program Office can’t get the contractor to do anything that it wants them to do given the budgets allocated and number of aircraft available. My experience tells me otherwise. If the GAO citation is correct, then shame on the Program Office for foisting the blame on the contractor.
Competent evaluation of program performance and sober observations resulting from such observations hardly drive web traffic, bring donors, or sell periodicals these days. (Just sayin') So while there are seeds above for quite a few questions that a curious ‘reformer’ or journalist (if either even exist) might use these seeds to ask the GAO some pretty hard questions if they were interested in understanding and reporting what might be really going on within the F-35 program.
Competent evaluation of program performance and sober observations resulting from such observations hardly drive web traffic, bring donors, or sell periodicals these days. (Just sayin') So while there are seeds above for quite a few questions that a curious ‘reformer’ or journalist (if either even exist) might use these seeds to ask the GAO some pretty hard questions if they were interested in understanding and reporting what might be really going on within the F-35 program.
Given the record of many of those so-called ‘reformers’, commercial websites and periodicals, we probably shouldn’t expect any sober observations. Given their demonstrated willful ignorance on the topic to-date, whether or not we could believe the answers reported is another question in itself.
 |
| F-35A, USAF Photo |
3 comments:
Very good summary on reliability growth, and you didn't even mention J.T. Duane, an engineering manager for General Electric.
John (no wonder he used his initials!) used simple calculus to lay out the management of reliability over time.
Later Larry Crow added some statistical rigor to invent the Army Materiel Systems Analysis Activity (AMSAA) methods of assessment, so management wouldn't make the wrong decision too soon, as the congress critters and GAO seem bound and determined to do.
All this has been well known for years, with references available on the internet. http://www.amsaa.army.mil/ReliabilityTechnology/RelTools.html
So if they read your complaint and don't change, it is because they don't want to know, and they have their fingers in their ears.
Great Link! Silly me. I was looking for just that kind of info in AF and RAC source data and it was hiding in the 'Army' bucket all along. I could have saved time posting by reusing their stuff. I'll start thinking more 'Army' (but not too much).
ARMY: More aircraft than the Air Force, more boats than the Navy, more amphibious landings than the Marine Corps.
They have to be doing something right.
Post a Comment