
What we’ve covered so far:
Part 1: “OK people, listen up. We’re going to fight this War on Terrorism and win, OK? That’s a given. And we’re going to do as much as we can to take care of everyone that will be affected by some changes we need to make to ensure our future. But what this is really about is making sure we have the tools and resources we’ve planned for so we can accomplish our mission in the future.” (and everything before the “but” is bulls***)
Part 2: “Let’s ignore the fact that when you stop reducing numbers of people the impact of pay raises on total personnel costs becomes apparent over time. This net cost growth per person was hidden in the aggregate cost as long as the forces size was being reduced. Also, don’t talk about how when you start moving your people around, use them in combat, and personnel costs increase. DO talk about personnel costs in an as abstract as possible way.” Thus, the AF’s ‘big idea’ amounts to this: “If we can reduce rising personnel costs (that Congress had intentionally increased over time) by ‘laying off’ the very people Congress was trying to take of in the first place, then Congress will give us more money for hardware.”
And now…..Part 3
The AF, having misrepresented (hell – Ignored!) the drivers behind a apparent [update: corrected sentence to how it should have read in the first place] rise in personnel costs, continues to mischaracterize “Today’s Fiscal Environment” through oversimplification and studious avoidance of identifying other root cost drivers. It seems as if they believe that if they oversimplify for the audience (the same people most in the know AND affected by this ‘reshaping’) the troops won’t notice two things:
1. The course the AF has chosen wouldn’t be ‘necessary’ if someone had headed off the budget train wreck when they saw it coming and…
2. This course of action is hardly the best one. It is just the easiest and most politically expedient one that a myopic leadership is willing to employ.
Caution!!!!!!!!!!!!!!!!!!!!!!!!!!!!!!
Unless you are a “bean counter”, comprehend the nuances of acquisition, and/or grasp the importance of logistics, your eyes may glaze over in this session
Beginning with the next two slides (8 & 9) in the ‘Fiscal Reality’ section of the brief…..
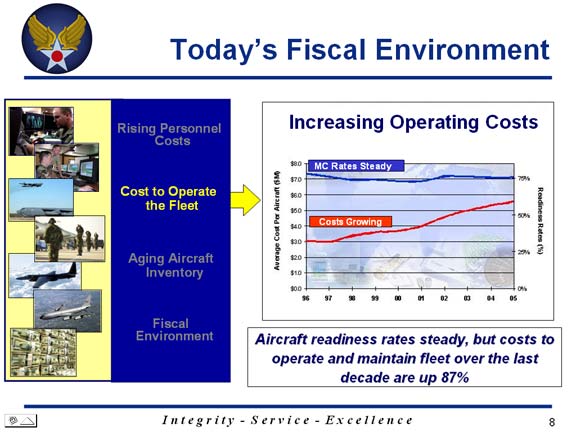
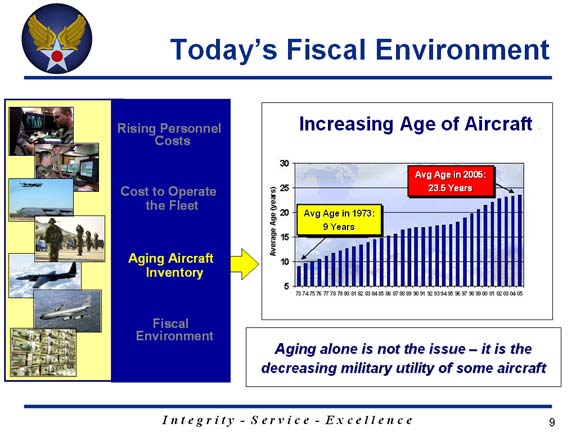
We see the briefing now attempts to illustrate a relationship between increased operating costs and age of the aircraft.
It is true there is a relationship, but these charts do not show it. How can we tell? Simple: Chart 9 merely shows the cost to operate aircraft in average ‘millions of dollars per aircraft’ over a very diverse aircraft fleet being used in very different ways and at varying operational tempos.
Assuming the AF chart makers still have integrity (not a stretch…yet), let us also assume (without any evidence to support the assumption) the charts are normalized to factor out the increased cost of consumables such as fuels and lubricants (you may have heard about the rise in cost of petroleum products pacing the cost of living these days). Let us then assume the costs shown represent only those costs incurred to keep the aircraft in a Mission Capable state reflected by the Mission Capable Rate (MCR) shown. The really big thing missing from Slide 8 is that you do NOT see is any indication as to how much the USE RATE (flying hours/year) is affecting total operating costs.
If the chart did reflect the impact of the use rate, the ‘Costs’ would be expressed in terms of average cost per aircraft flight hour. It is entirely possible that the chart makers specifically avoided showing that statistic because it could actually be dropping, because it costs X amount of dollars to fix malfunctions whether you operate the aircraft or not. If a plane is flying longer or more sorties than usual (common in wartime scenarios), the failures & fixes per flight hour and the repair costs can go up or down for several reasons, including dependence on where the aircraft is in its lifecycle. Towards the end of the lifecycle is where the age of hardware comes into play as an increasing cost driver.
Physical age in years doesn’t necessarily mean much to failure rates, while the amount of use (flying hours) during those years is meaningful. Physical age is more relevant to the costs of repair, because part obsolescence, economic order quantities, and supplier business models all play a role. This is now a particularly acute problem with electronic parts. Weapons system acquisition programs now have to make many more decisions at the start of a program as to whether to:
1. pay for the continued production overhead of an existing part,These questions were once a major concern more towards the middle or end of a weapon’s lifecycle, but now contractors must demonstrate a robust approach to deal with obsolescence just to be awarded the contract in the first place.
2. forecast a lifetime buy quantity to purchase and warehouse for future needs or,
3. implement a preplanned system redesign program to keep the technology fresh.
So now we know what the relevance of age is to cost. Why didn’t the AF brass direct the chart makers to show what parts of the fleet are the problem instead of presenting a broad-brush and meaningless fleet average? Is the whole fleet the problem? Is the Air Force throwing away manpower so they can afford to buy a “totally new Air Force”? Aren’t some types are older than others?
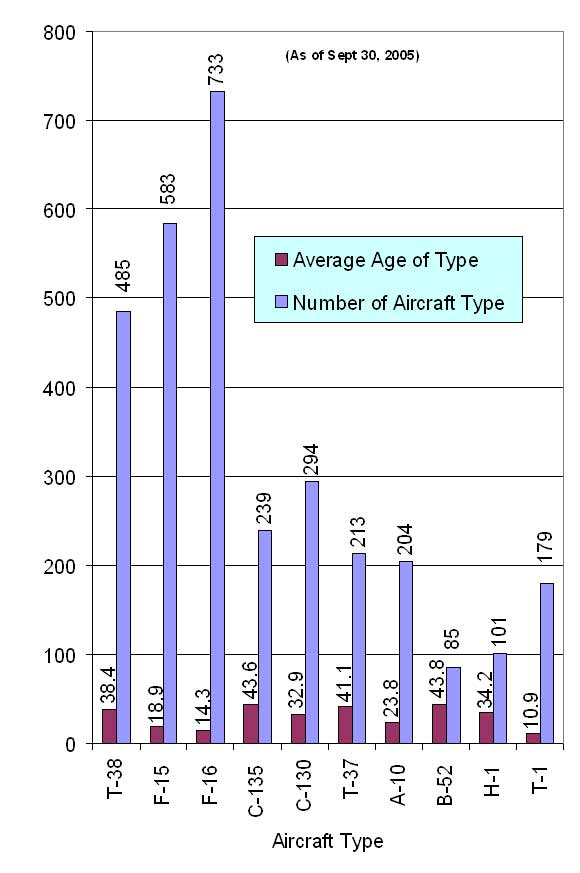
To get the answers, let us now dig into the details behind the AF’s aircraft age chart. Using publicly available numbers (pdf file) , here’s what the average age of Air Force aircraft looks like broken down by type:
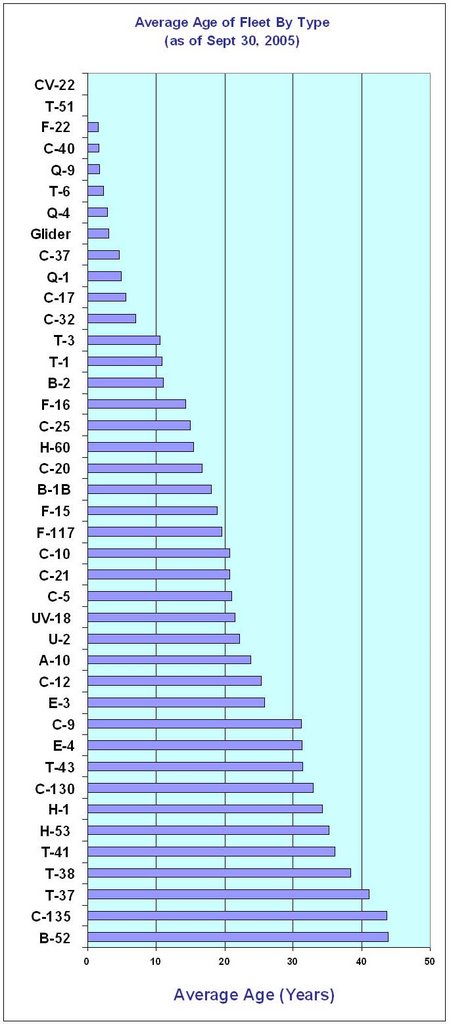
Anyone familiar with the Air Force would see no surprises as to which aircraft types are oldest. However the average age by type doesn’t reflect the impact of each type on the fleet average, because each type has a different impact based on the percentage of the fleet the type represents. More airplanes = more impact. This could be a positive impact by many young systems or a negative impact from many old systems. ‘Racking and Stacking’ by relative weights (average age of type times the percentage of fleet the type represents) we can demonstrate which aircraft types have the most impact (for better or worse) on the ‘fleet average’ number as shown here:
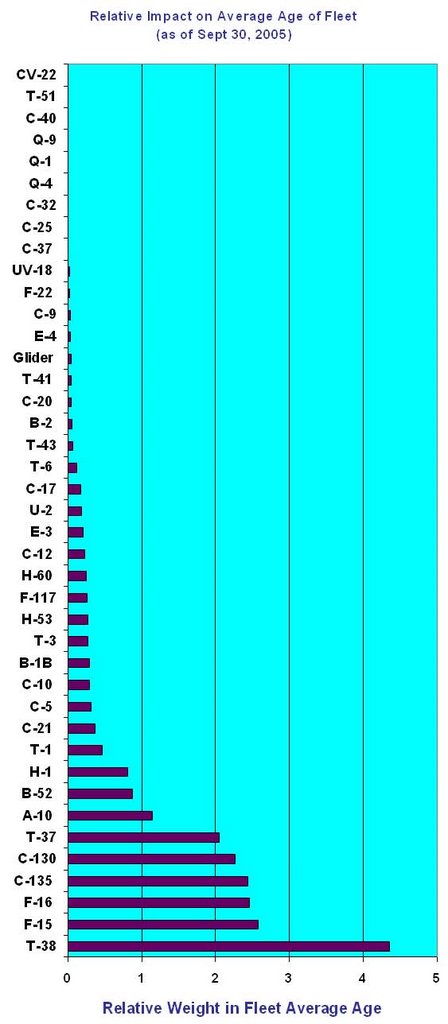
By just looking at the plot above, you will observe that by an overwhelming margin, a relative few aircraft types have the most impact on the total fleet average age. Looking at the top ten “age drivers” we see that they represent over five and a half times the impact the remaining 31 aircraft types combined have on the overall fleet average age.
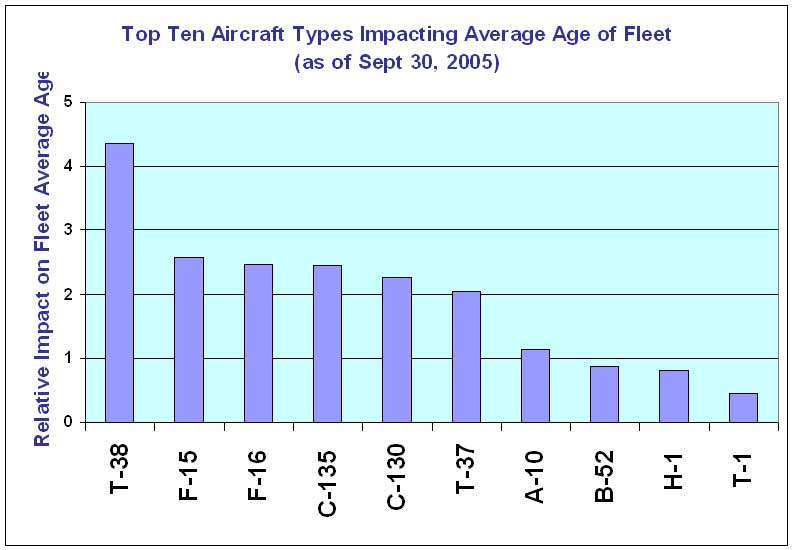
The Top Ten ‘Impacters’ are mostly what I would have expected. The only surprise to me is the T-1 ‘Jayhawk’. Since that type isn’t very ‘old’ the AF must have bought more of them than I recalled. Clearly though, the ratio of ‘old’ to ‘new’ can be claimed to be 9 to 1. Note: The F-15 and F-16 fleets may be approaching ‘middle-age’ compared to the B-52, but with a ‘yank and bank’ history and a requirement to survive in the most hostile environments, fighters can be considered to age ‘faster’. Also, the secret to the long life of the B-52, (aside from the powers of nostalgia) has been its adaptation to roles that remove it from the highest threat operating environments; an option not available to fighters.
This list is a good stepping stone to introduce a few more detailed observations:
1. The T-1 fleet is relatively young and represents the 8th most numerous type. These aircraft drive the age curve to skew to the left, but are more than counterbalanced by all the old planes whose age skews the ‘average’ (such a meaningless term by itself) to the right.As long as the AF decides to upgrade instead of buy new, we have to assume it is because it is cheaper to keep these systems than replace them, or the fight to get the money to replace them isn’t worth it.
2. A conscious decision to keep aging T-38 (Talon) and T-37 (Tweet) trainers has been made several times. The AF finds it cost-effective to perform ‘SLEP’(service life extension program) upgrades to them and fiddle with their flight envelopes to squeeze more life out of them than replace them. ‘Age’ as far as the Air Force is concerned is 'taken care of' with these aircraft
3. C-130s have been the workhorses since they’ve been fielded, they’re not getting any younger, the C-130Js aren’t being bought in the numbers they probably should be given the airframe service life they’re consuming, and the avionics upgrade program for the older models is experiencing ‘problems’.
4. B-52s. B-52s. Their true fleet mission-capable rates and maintenance costs over the last 20 or so years was/is hidden behind a little Congressionally-mandated requirement that co-located the attrition reserve fleet with the combat-coded aircraft. This allowed some operating units to rotate aircraft in and out of the CC pool and incur costs and downtime away from the O&M accounts. There’s not a lot of them (anymore) so their advanced age skews the average age higher, but their cost impact is (relatively) trivial. If they could survive in a high-threat environment, we could keep them almost forever. The AF is considering new Long Range Strike (LRS) options at this time, but whatever is decided, the LRS solution won’t be to replace the Buffs (Standoff Attack), it will be replacing the Bones (B-1s, Direct Attack)
This leaves us with just the REALLY big age/cost drivers to discuss:
1. The F-16 fleet is relatively young and is the most numerous type. The major reason the average age of the F-16 fleet isn’t higher is because many older models have been retired or ‘surplused’. The average age still includes a lot of old (for fighters) airframes with older avionics and other systems though. Future survivability concerns have to factor into the obsolescence equation, but the AF doesn’t really talk about that as much as they should. It is much easier to talk about ‘old’ vs. ‘new and improved’ than to explain radar cross-section and detectability.
2. The F-15 fleet is chronologically 30%+ older than the F-16 and probably much older average flying hours-wise. And there’s A LOT of them. On some of them, the systems on board are another half to full-generation behind the latest F-16s, so the F-22 (partial) replacement is sorely needed.
3. We really DO need a tanker replacement….BAD. They are old, the oldest are really old, and newer engines or not, we’ve flown the wings off them keeping the rest (especially the short-legged fighters and the big airlifters) of the Air Force flying. [We would have had one on the way too, if McCain hadn’t decided to get all pissy on the acquisition strategy. Never underestimate the power of ‘manhood’ issues with self-important Congress-people who want to be something more. The Darlene Druyun flameout didn’t help either.]
So we see the ‘problem’ really isn’t fleet age, but the age of a relatively few aircraft types that make up a large proportion of the fleet. Why are these so ‘old’? Because the AF has failed to get several major acquisition program buy-in from Congress in the first place, or proper support of programs once launched (the AF has been particularly inept in keeping the F-22 sold). This has not been ALL the AF’s fault of course. Les Aspin (spit!) and the Clinton administration would be my number one villains in the complete disappearance of rationality from balancing need and cost in the budget process of the 90’s, with a complicit Congress squeezing every last dime from a non-existent ‘Peace Dividend’ coming in a close second. (we won’t talk here about how the departure from saneness actually began under Carter in the 1970’s – that was another travesty) This superpower-on-a-shoestring mentality only delayed ‘paying the piper, and the ‘piper’ charges interest.
The REAL Problem
If the AF insists that fleet age is the problem, then the problem reaches all the way back to 1973 where, according to chart 9 of the pitch, the fleet average age was only 9 years! I fault the current and prior AF leadership most for not making their case for more money to properly fund their slice of the defense responsibility. It seems either an odd form of cowardice, or complete lack of leadership has paralyzed the AF as an institution.
That an AF leadership would choose to throw a large portion of the force on the street instead of calling attention to the mismanagement of the past even if it meant falling on their own swords is, in a word: disgusting.
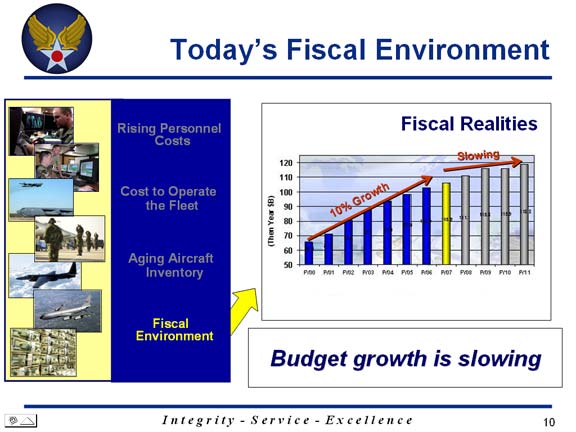
Speaking of AF leadership making their case, here’s the next slide (slide 10) of the brief.
Powerpoint Warriors Attack!
“Budget Growth is Slowing”? Now Ladies and Gentlemen, THIS is “professional grade” shtick in powerpoint! The uninitiated may not appreciate the subtle elegance of it, so a short tour is in order.
1. Note the use of a non-zero baseline that accentuates the ‘10% Growth’ side of the slide. Starting where it does just about doubles the apparent steepness of the ‘growth’ slope.
2. Note the slope of the two arrows and how closely the left arrow matches the growth to-date. What is with the slope of the arrow on the ‘projected’ side? A cynical mind might think the slide creator was attempting an optical illusion. If one matched the arrows slope on the right as closely as the one on the left, it would look like almost the same slope with a little saw-tooth dip at FY07.
3. Remember the left side is what HAS happened, the right side is somebody’s “idea” of what is GOING to happen. What did the left side look like when it was just an “idea”?
4. The chart is in “then year” dollars! To give you an idea how this inflates the number, $1 in 2005 is the same as the following in 2000 dollars
$1.13 using the Consumer Price IndexOr in layman's terms, even if there was no real growth between 2000 and 2005, the chart would still reflect between 13 to 27 percent growth over the same timeframe.
$1.21 using the nominal GDP per capita
$1.27 using the relative share of GDP
A more appropriate title of the above slide would have been: “AF Leadership 101 – Avoiding Real Budget Issues While Assuming Risk as a Long Term Conflict Resolution Strategy”. But I guess that would have been a tad too long to fit in the slide header.
And of course, NONE of this explains why the AF chooses to eliminate people instead of making the case for more money. We will examine the AF’s reasons in Part IV, but first here is ‘Question 7” where the AF chooses to start talking about the ‘bottom-line’. Not much of a segue, but hey!-It’s their spiel, and they’re sticking with it.

There’s a couple of fine points to be made here.
1. The AF’s whacking the civilian force is small yet still somewhat overstated: many if not most of the civilian reduction will be taken care of through normal attrition and retirements. They’re actually talking about having to increase hiring soon after the make their cuts. (Good luck getting anyone to come back after they’ve been jerked around.)Note the last line at the bottom of slide 12. That will be my Pee Wee Herman (Everyone I know has a big "But") teaser for the next installment, where the AF inadvertently, yet brilliantly sums up the US military’s slide into ‘superpower-lite’ status before launching off into delusional flights of fancy about how everything will be better at the end of the yellow-brick road.
2. While the Guard and Reserve got a ‘pass’ the first two years, they get hit after FY07. This is after a lot of active duty folks got ‘purged’ and encouraged to go Guard and Reserve. I guess this is just the AF’s way of trying to ‘take care of people: some might get taken care of TWICE!
No comments:
Post a Comment